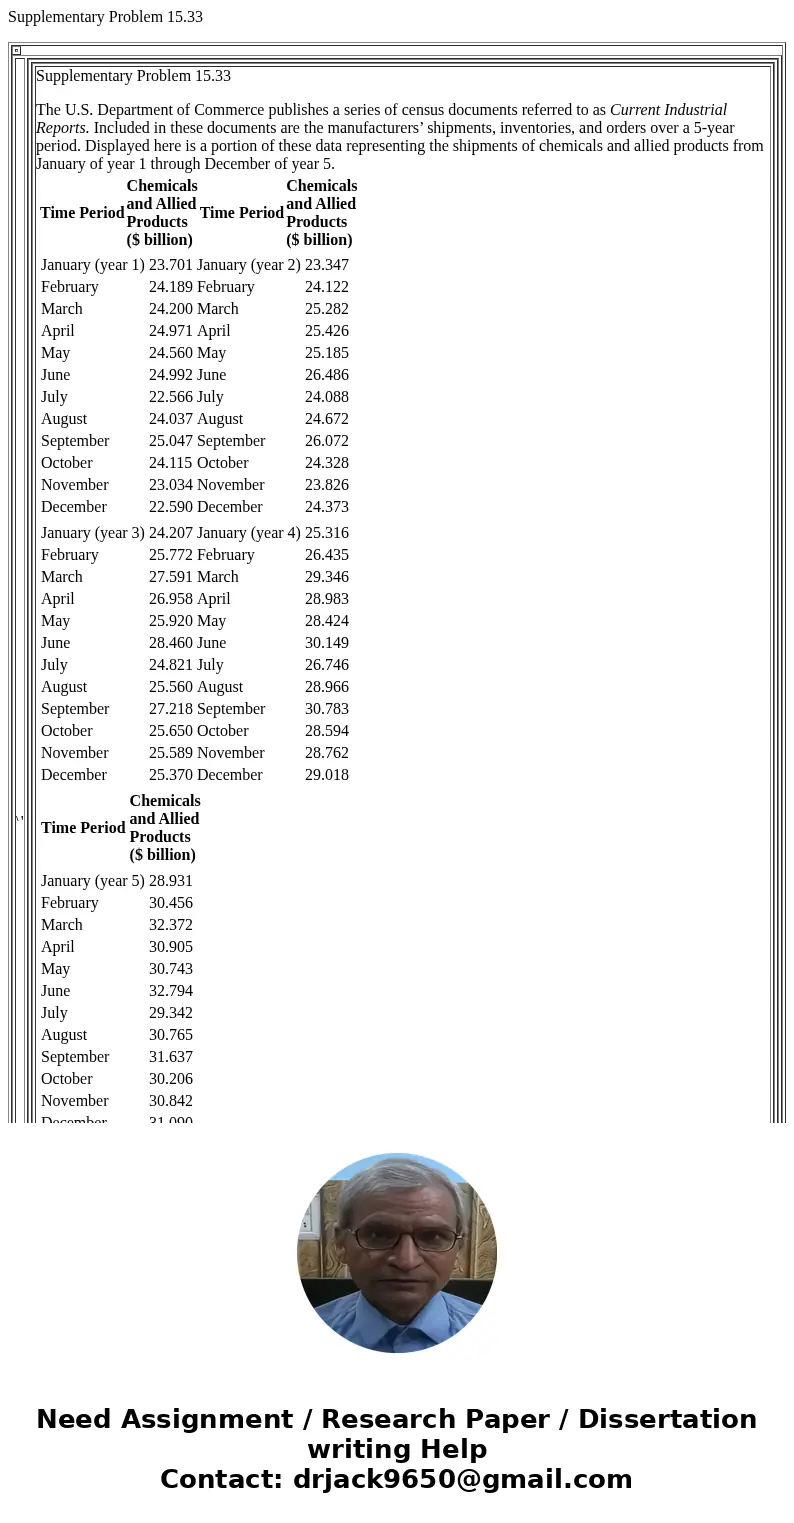
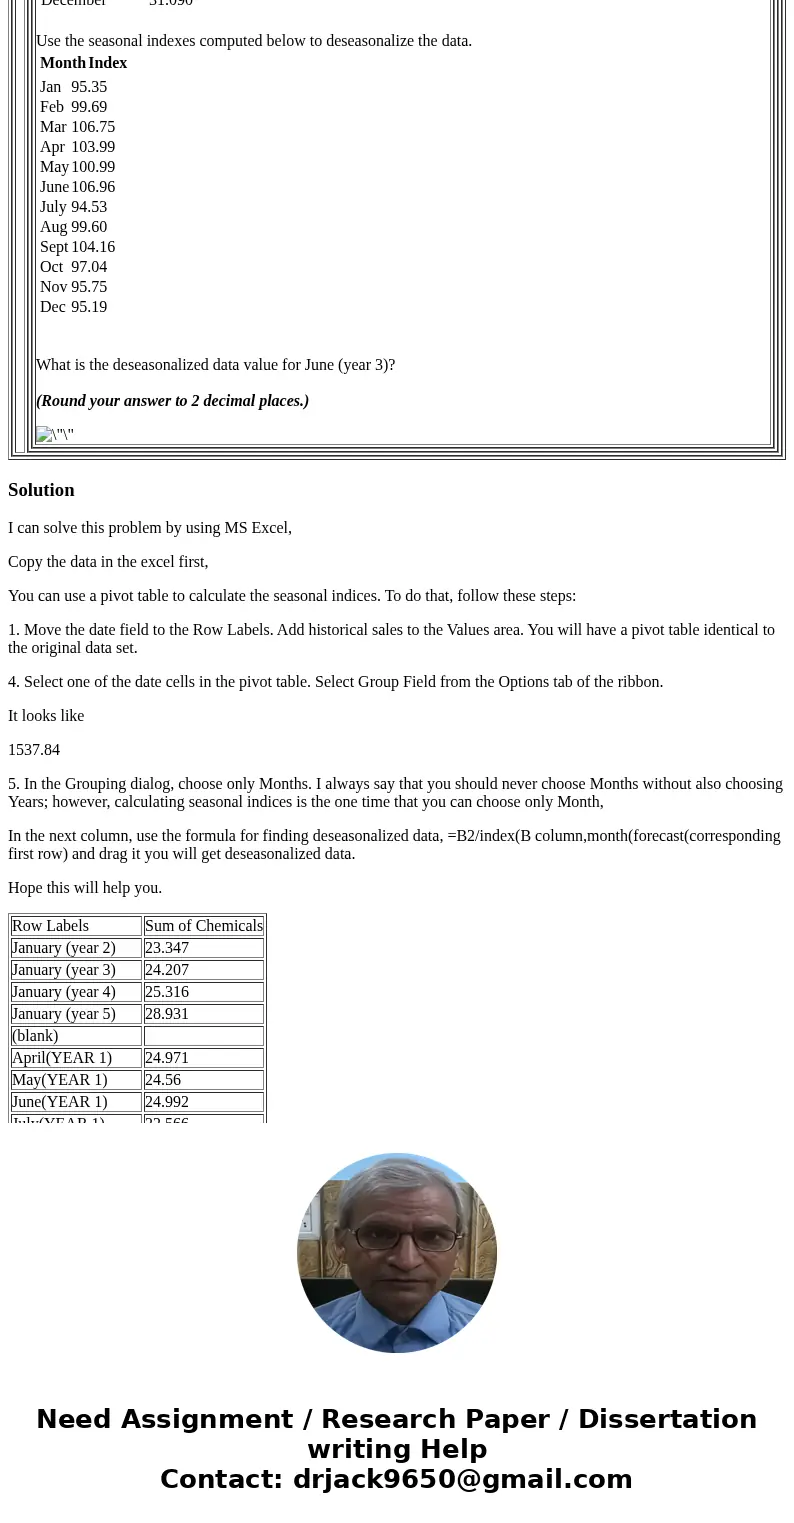
Supplementary Problem 1533 Supplementary Problem 1533 The US
Supplementary Problem 15.33
|
Solution
I can solve this problem by using MS Excel,
Copy the data in the excel first,
You can use a pivot table to calculate the seasonal indices. To do that, follow these steps:
1. Move the date field to the Row Labels. Add historical sales to the Values area. You will have a pivot table identical to the original data set.
4. Select one of the date cells in the pivot table. Select Group Field from the Options tab of the ribbon.
It looks like
1537.84
5. In the Grouping dialog, choose only Months. I always say that you should never choose Months without also choosing Years; however, calculating seasonal indices is the one time that you can choose only Month,
In the next column, use the formula for finding deseasonalized data, =B2/index(B column,month(forecast(corresponding first row) and drag it you will get deseasonalized data.
Hope this will help you.
| Row Labels | Sum of Chemicals |
| January (year 2) | 23.347 |
| January (year 3) | 24.207 |
| January (year 4) | 25.316 |
| January (year 5) | 28.931 |
| (blank) | |
| April(YEAR 1) | 24.971 |
| May(YEAR 1) | 24.56 |
| June(YEAR 1) | 24.992 |
| July(YEAR 1) | 22.566 |
| August(YEAR 1) | 24.037 |
| September(YEAR 1) | 25.047 |
| October(YEAR 1) | 24.115 |
| November(YEAR 1) | 23.034 |
| December(YEAR 1) | 22.59 |
| February (year 3) | 25.772 |
| March (year 3) | 27.591 |
| April (year 3) | 26.958 |
| May (year 3) | 25.92 |
| June(year 3) | 28.46 |
| July(year 3) | 24.821 |
| August(year 3) | 25.56 |
| September(year 3) | 27.218 |
| October(year 3) | 25.65 |
| November(year 3) | 25.589 |
| December(year 3) | 25.37 |
| February(year 2) | 24.122 |
| March(year 2) | 25.282 |
| April(year 2) | 25.426 |
| May(year 2) | 25.185 |
| June(year 2) | 26.486 |
| July(year 2) | 24.088 |
| August(year 2) | 24.672 |
| September(year 2) | 26.072 |
| October(year 2) | 24.328 |
| November(year 2) | 23.826 |
| December(year 2) | 24.373 |
| February(year 4) | 26.435 |
| March(year 4) | 29.346 |
| April(year 4) | 28.983 |
| May(year 4) | 28.424 |
| June(year 4) | 30.149 |
| July(year 4) | 26.746 |
| August(year 4) | 28.966 |
| September(year 4) | 30.783 |
| October(year 4) | 28.594 |
| November(year 4) | 28.762 |
| December(year 4) | 29.018 |
| February (year 5) | 30.456 |
| March (year 5) | 32.372 |
| April (year 5) | 30.905 |
| May (year 5) | 30.743 |
| June (year 5) | 32.794 |
| July (year 5) | 29.342 |
| August (year 5) | 30.765 |
| September (year 5) | 31.637 |
| October (year 5) | 30.206 |
| November (year 5) | 30.842 |
| December (year 5) | 31.09 |
| Grand Total | 1537.84 |


 Homework Sourse